Kenya Population Density Analysis
Using Python Libraries; Pandas, Geopandas, Matplotlib, and Leaflet.js
Kenya Web Map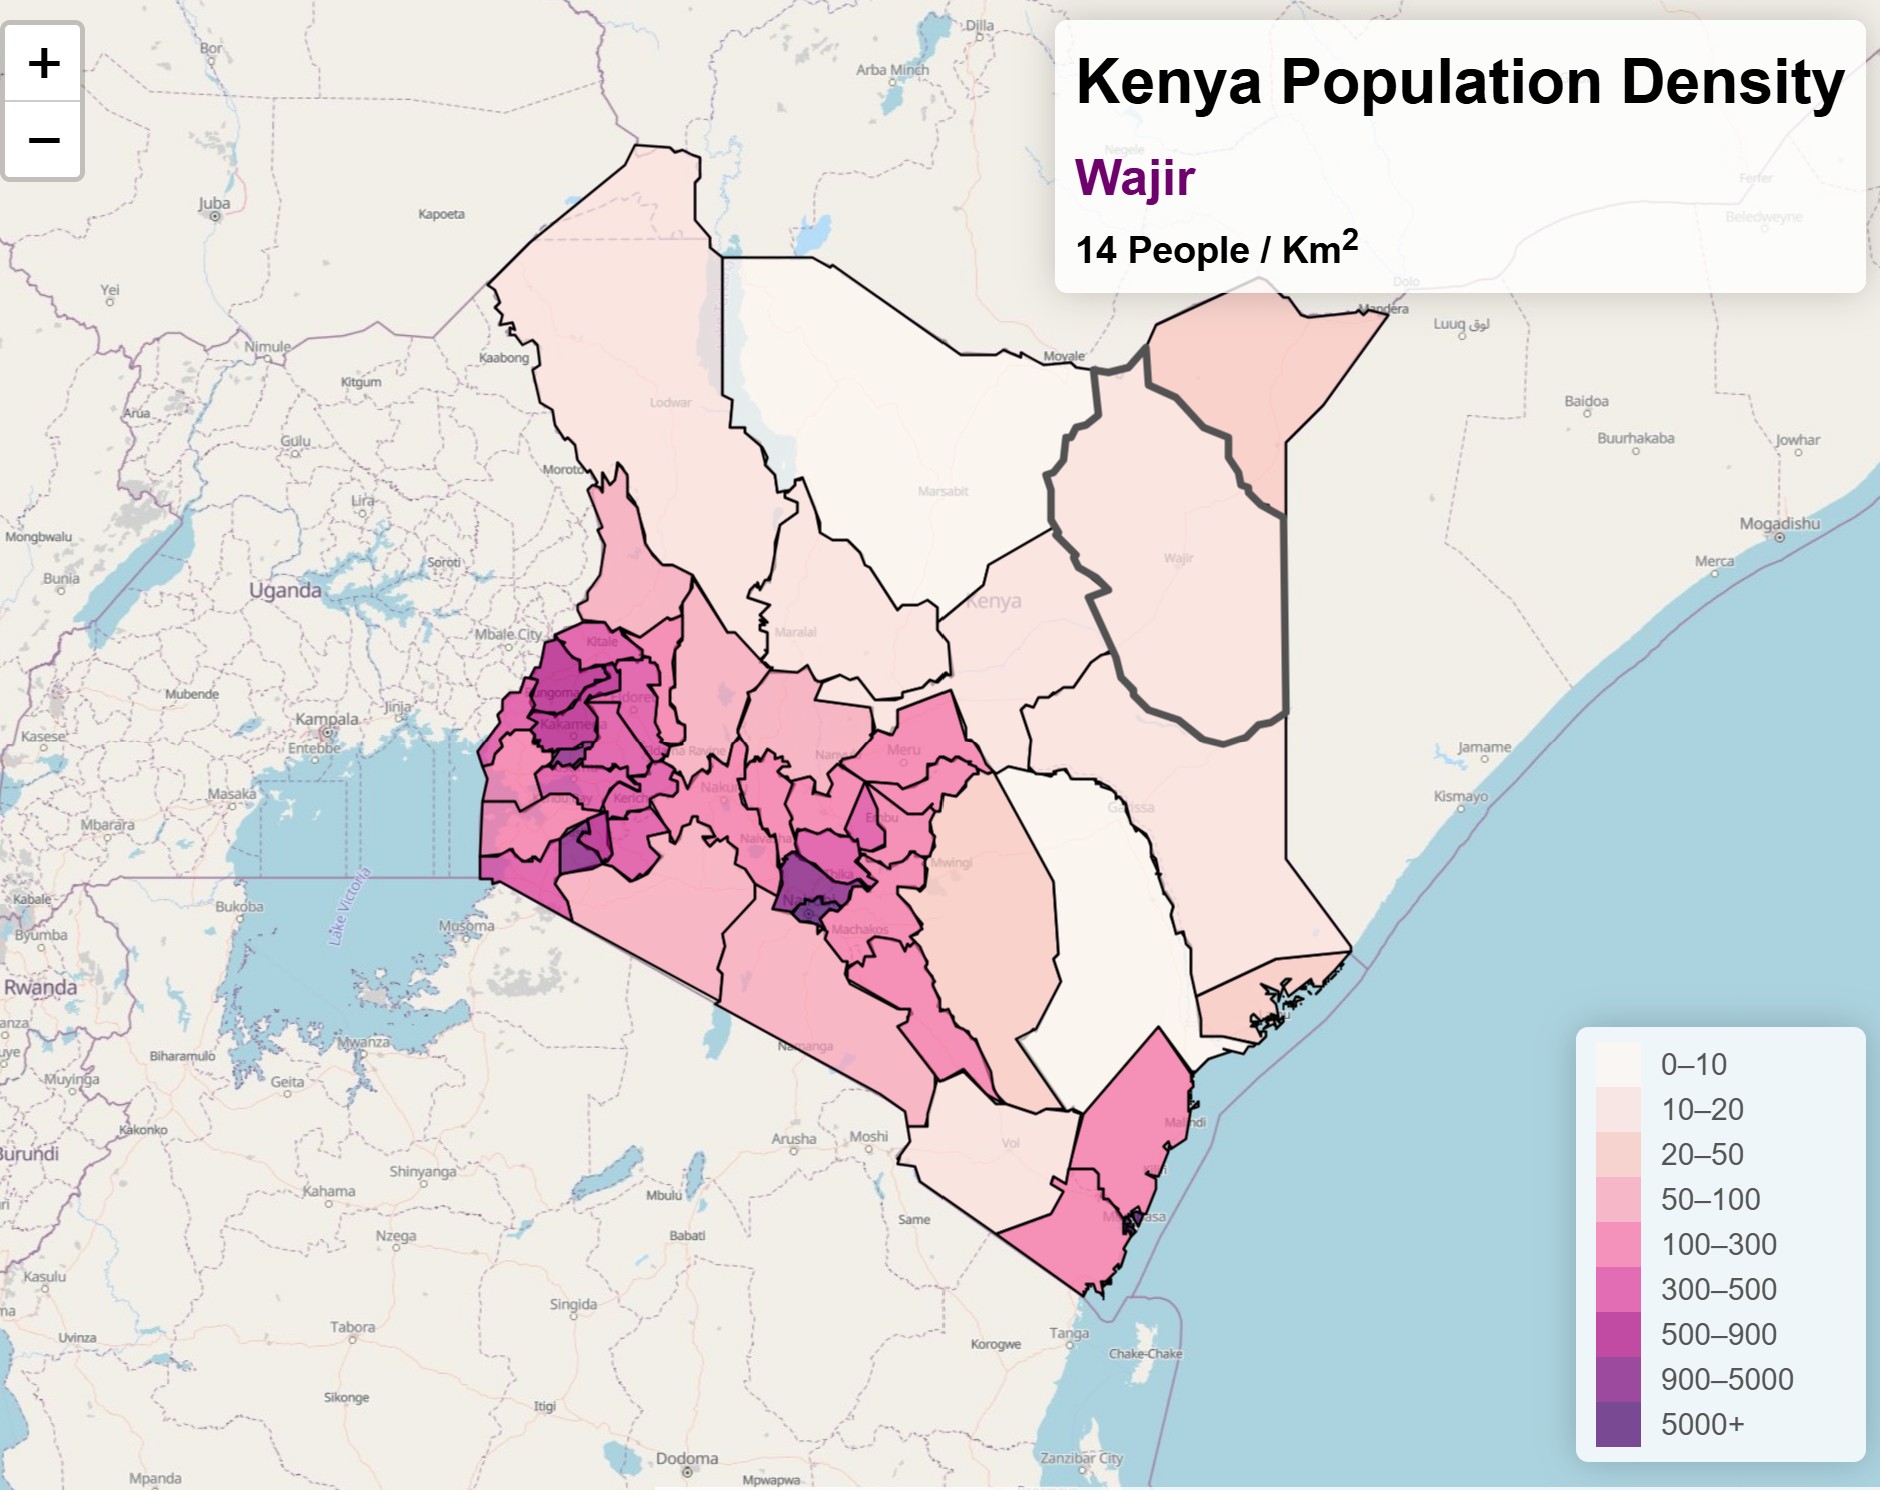
Using Python Libraries; Pandas, Geopandas, Matplotlib, and Leaflet.js
Kenya Web MapTheresa Monari
Personal Project
GIS Programming
Pandas, Geopandas, and Matplotlib are powerful Python libraries for handling vector data and visualization respectively. This project dives into analyzing the population density across Kenya's 47 counties. The results are presented in tables, bar graph, and an interactive choropleth map created using Leaflet.js. Each county's population density can be viewed on the interactive map by clicking on the specific county.
Theresa Nyatichi Monari
Email: nyatichitheresa@gmail.com
Please feel free to contact me. I look forward to hearing from you!