Cape Town Suburbs Water Consumption
Using Python Libraries; Pandas and folium to Analyze Geospatial Data
Cape Town Web Map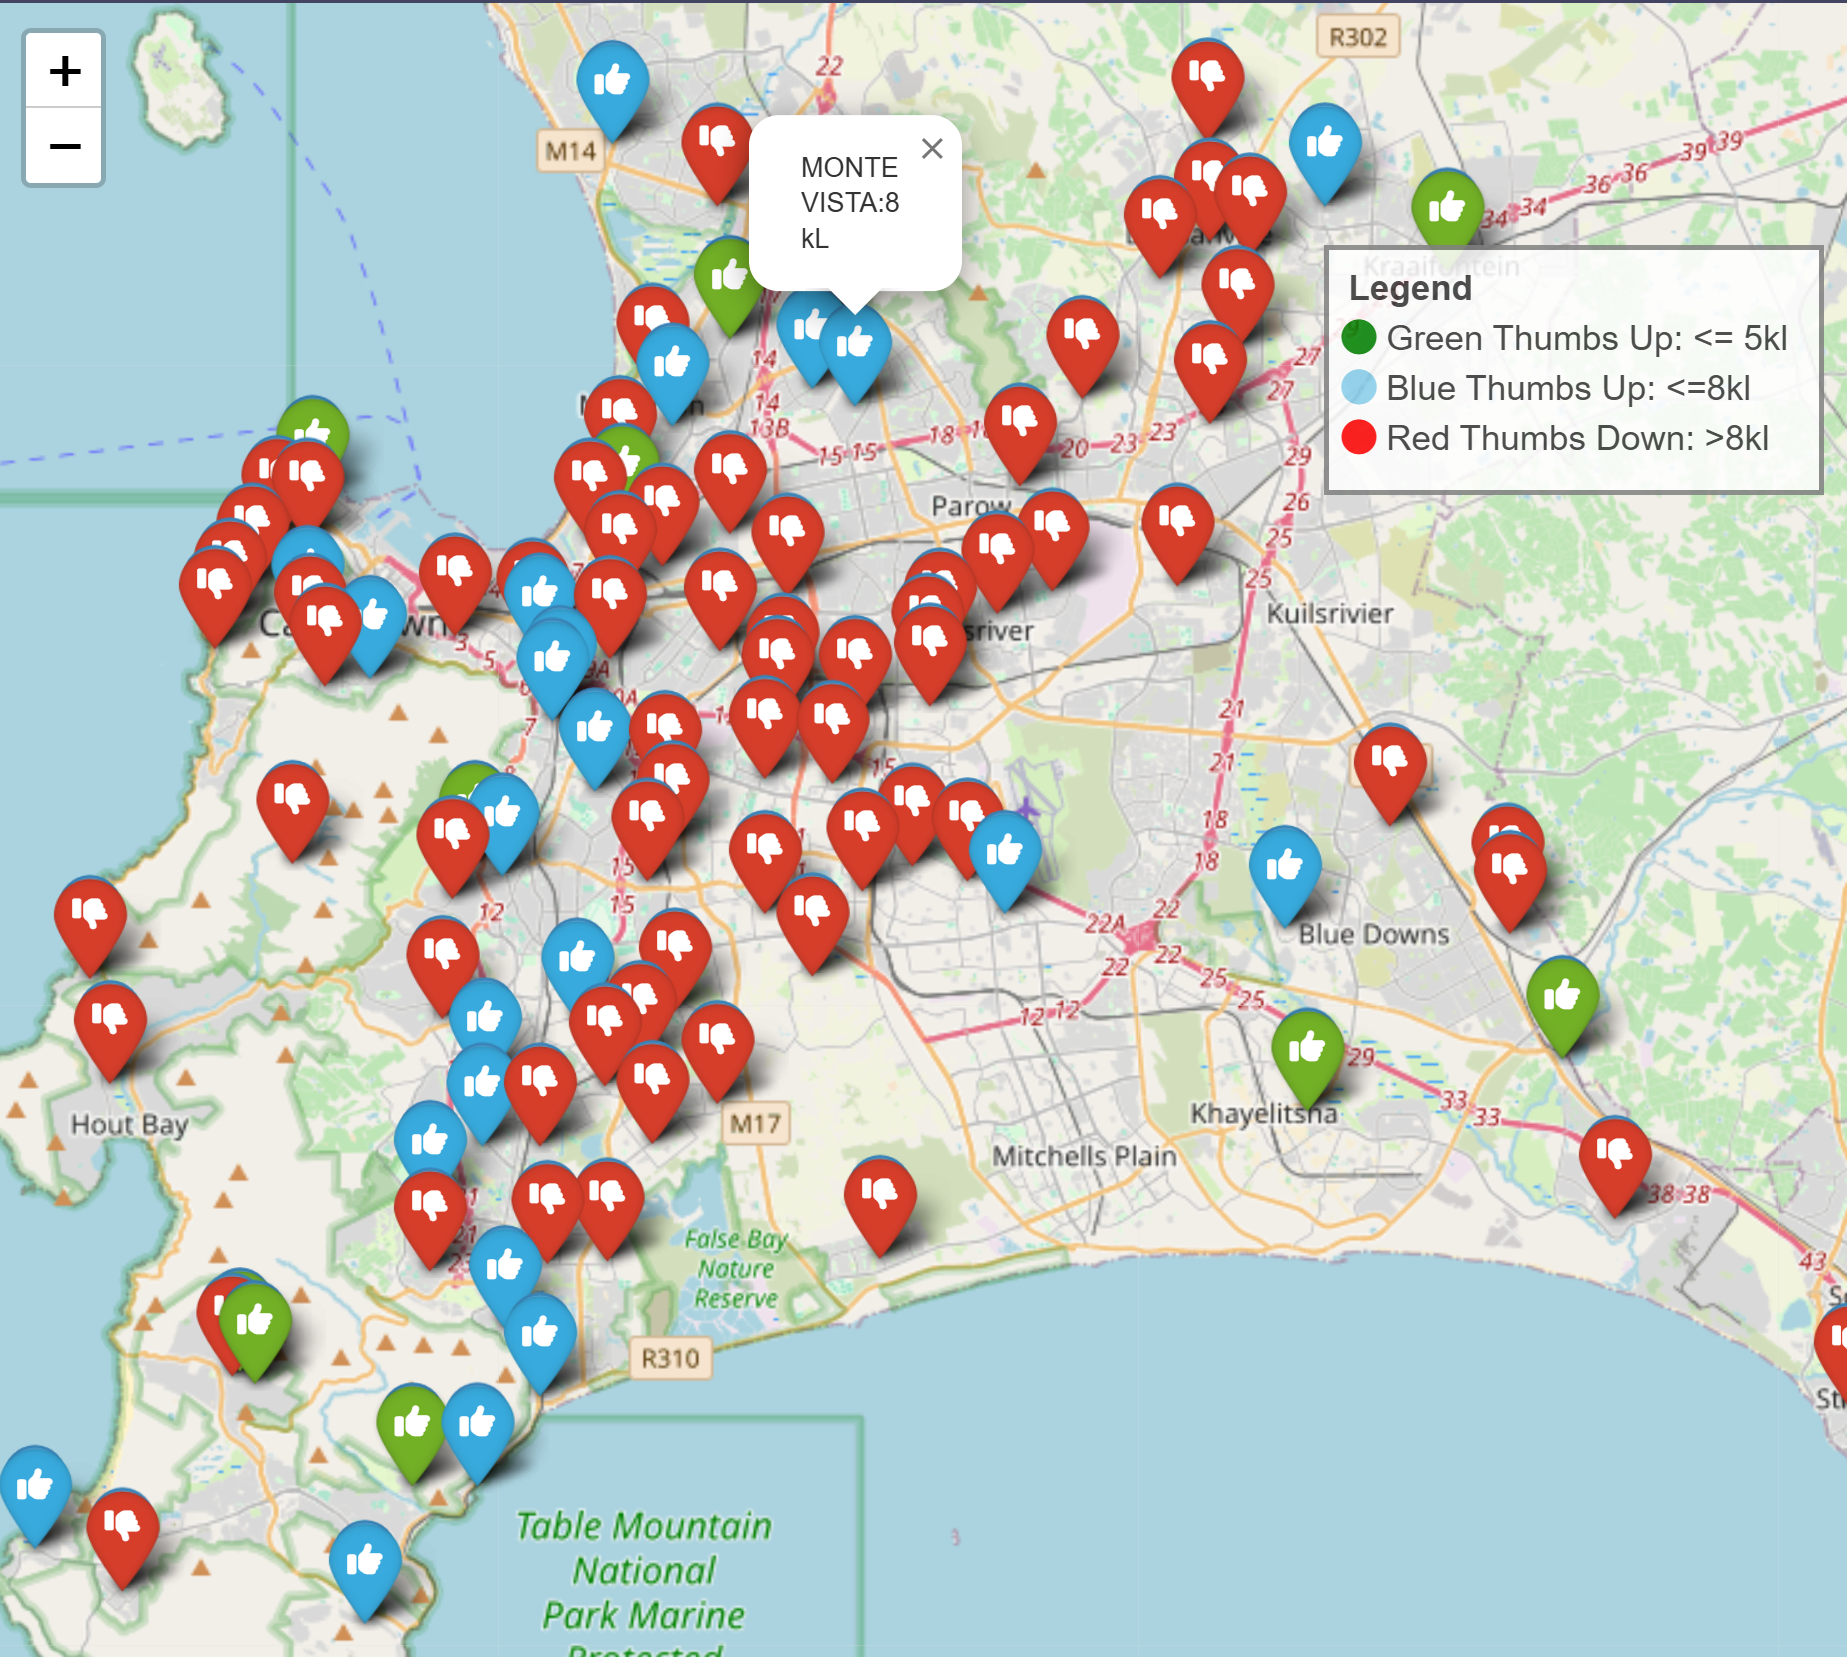
Using Python Libraries; Pandas and folium to Analyze Geospatial Data
Cape Town Web MapTheresa Monari
Personal Project
Web GIS
This project features the 2017 water crisis in Cape Town city in South Africa. The analysis utilizes Python's pandas and folium libraries. The map shows the 2017 average water Consumption per suburb in the month of October. Users can select points showing pop-up of the suburb name and water Consumption per kilolitre.
Theresa Nyatichi Monari
Email: nyatichitheresa@gmail.com
Please feel free to contact me. I look forward to hearing from you!